Toolset helps you in displaying your custom content on the front-end but sometimes the results are not what you expected or intended. To understand what is happening, and why, it is necessary to use appropriate tools for debugging.
There are different ways of debugging Toolset plugins, depending on the type of the problem you are facing.
General Toolset Debugging
If you encounter a general issue with any of the Toolset plugins, there are two main types of debugging you can use to debug the issue: PHP Debugging and JavaScript debugging.
These two types of debugging provide you with some very technical information. You can use it to do an online search for a possible solution or cause to the problem, or to provide additional information to our Customer Support when opening a ticket.
PHP Debugging
To enable PHP debugging in WordPress, edit your wp-config.php file and add the following:
ini_set('log_errors',TRUE);
ini_set('error_reporting', E_ALL);
ini_set('error_log', dirname(__FILE__) . '/error_log.txt');
This produces a file error_log.txt in your WordPress root directory. Make sure that the web server can create and write this file. If it cannot, use an FTP program to create the file and make it writable to Apache (normally, the www-data user).
After this is enabled, all errors that occur when using your website’s front-end and backend, are logged into that error_log.txt file.
Javascript Debugging
Many of the operations in WordPress require Javascript. Any JavaScript error, caused by anything, may stop all further Javascript execution and prevent things from functioning properly.
JavaScript debugging is done using the browser’s built-in Developer Tools, more specifically, using a JavaScript Console. Today, all major browsers feature Developer Tools and a JavaScript Console:
- In Chrome, click the Main menu button->More Tools->Developer Tools. Select the Console tab.
- In Firefox, click the Main menu button->Developer->Web Console.
- In Internet Explorer, click the Tools button->F12 Developer Tools. Select the Console tab.
- In Edge, click the More button->F12 Developer Tools. Select the Console tab.
Once the Console is open, it should be clean of any error (red) messages. Some console warnings (yellow) may appear and are usually not a cause for alarm. However, if you see an error message, we should know about it.
The Views debug tool
Views plugin has a built-in debug mode, which helps you analyze the output of any View or Content Template in details.
If you are debugging something that does not work, we recommend that you first enable the debug mode and try it on a View that works as you intend. This will help you understand the debug output better. You can then proceed to the View that you want to debug, and do that much easier.
Watch the following video to see the basic usage of the View debug tool.
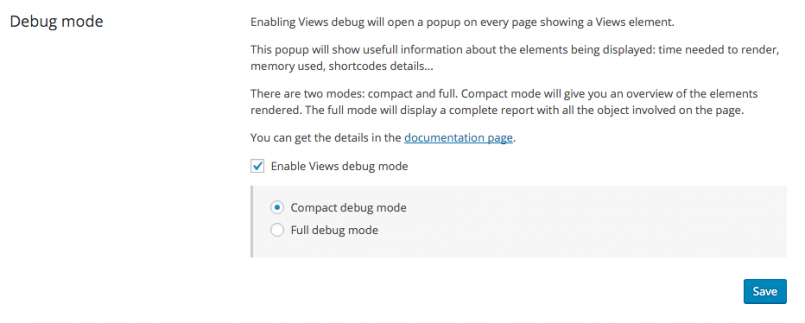
To enable the Views debug tool, go to Toolset->Settings, click on the Front-end Content tab and look for the section called Debug mode.
The debug tool is disabled by default. Once enabled, you can choose between two modes:
- Compact debug mode: displays basic information, without information about filters and hooks executed by Views.
- Full debug mode: shows the same basic information plus all the details about the filters being applied during a Views request and the results of every query performed by Views.
The Views debug tool shows the results of its analysis in a pop-up window that opens when you visit any page of your site containing a View or Content Template. Some browsers block that kind of pop-ups from being opened, so Views debug tool provides a simple test to check your browser settings.
Following list provides links to instructions for allowing pop-ups in all major browsers: Mozilla Firefox, Internet Explorer, Google Chrome, Opera.
Debug output
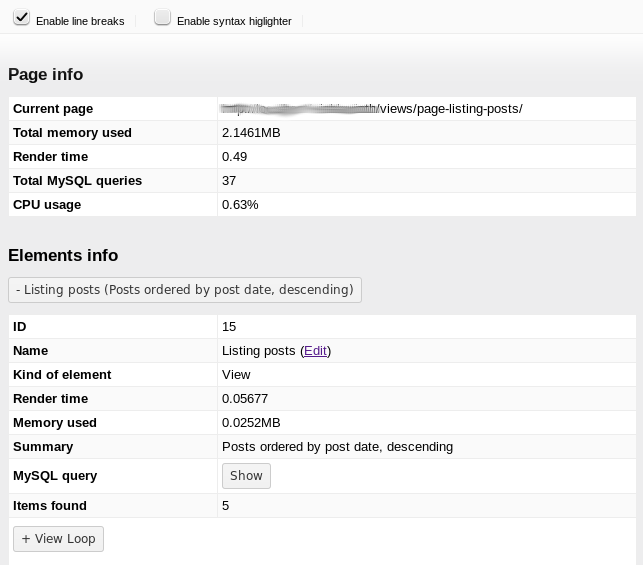
In the popup generated by the debug tool, there is a lot of information:
- The page being displayed, the memory used to display it and the CPU usage, along with the number of SQL queries.
- Details about every View or Content Template being used on that page: render time, memory used, SQL query arguments and results.
- If you are using nested elements (like a View inside a View, or a View using Content Templates to display elements), all the information is displayed in a nested structure too.
- Each element displays the original content, the shortcodes being used (with information about their attributes and output) and the output generated.
This way, you have all the information needed to see what is happening at every moment.
There are two options in that debug popup:
- Enable line breaks: wraps the texts so they fit in the window width. Unchecking it displays horizontal scroll-bars when needed.
- Enable syntax higlighter: adds syntax highlighting to the parts that display some kind of code (like SQL queries and filters or shortcodes information). Note that when using the full debug mode, opening a very long section with this syntax highlighting tool enabled can cause some browser delay.
Alternative debugging method
The Views plugin also features a more generic debug tool that displays some information in the browser console.
Follow these two steps to enable this debugging method:
- Enable WordPress debugging.
- Enable outputting debug to a Console.
- Enable WordPress debugging
Open your wp-config.php file and change the WordPress debugging mode to TRUE:
define('WP_DEBUG', true);
This enables the WordPress native debug system and displays all PHP errors, notices and warnings. You can read more information about Debugging in WordPress here.
This PHP messages often contain the name and the line of the file that is causing the bug. This helps you to identify errors coming from one of our plugins.
- Enable outputting debug to a Console
Add the following line to your wp-config.php file:
define('TOOLSET_LOGGING_STATUS', 'info');
Then, open the JavaScript Console in your browser. Check the JavaScript Debugging section above to learn how to open the Console in all major browsers.
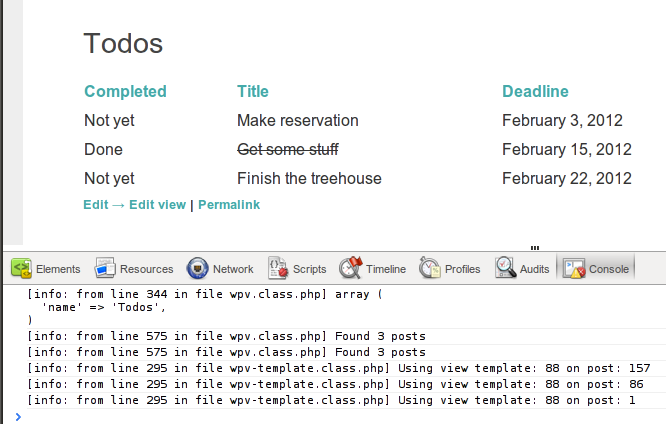
The console panel shows you everything that happens to display this page.
Let’s take a look at the example shown in the above image:
- It starts by loading the View called “Todos”.
- Then, the View tells us it loaded 3 posts (my 3 todos) and that it is calling a Content Template to render each of them.
- We can see the post ID that’s loaded in each iteration.
Advanced Debug Information
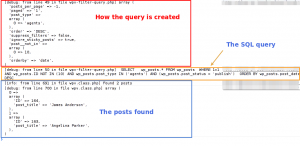
You can get more detailed debugging information about the query that Views is using. Add the following to your wp-config.php file:
define('TOOLSET_LOGGING_STATUS', 'debug');
The console will now display details of how the View query is created, the SQL query executed and the posts found.


