This is the technical support forum for Toolset - a suite of plugins for developing WordPress sites without writing PHP.
Everyone can read this forum, but only Toolset clients can post in it. Toolset support works 6 days per week, 19 hours per day.
| Sun | Mon | Tue | Wed | Thu | Fri | Sat |
|---|---|---|---|---|---|---|
| - | 9:00 – 13:00 | 9:00 – 13:00 | 9:00 – 13:00 | 9:00 – 13:00 | 9:00 – 13:00 | - |
| - | 14:00 – 18:00 | 14:00 – 18:00 | 14:00 – 18:00 | 14:00 – 18:00 | 14:00 – 18:00 | - |
Supporter timezone: Asia/Karachi (GMT+05:00)
Tagged: Types plugin
This topic contains 8 replies, has 3 voices.
Last updated by ericE-4 3 years, 5 months ago.
Assisted by: Waqar.
On my site I have a custom post type, and I currently have 117 posts. I have always found that Toolset rendered extremely slowly, which has forced me to upgrade to a supper fast (and expensive) server to compensate. I want to obtain an answer as to why Toolset makes my site so slow, and find out if there's anything that can be done about it or if that's just because it's poorly programmed.
I've created a staging site to perform some testing and illustrate the issue.
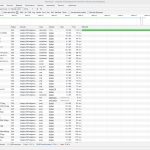
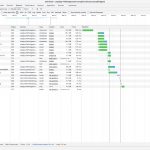
First, to eliminate other plugins as the cause, I deactivated every plugin except Toolset Types and Toolset Views. Then I cleared the browser site cache and did a series of tests to examine the waterfall in Chrome's inspector for the page hidden link.
With only Toolset plugins active, the average time to load the first file (main HTML) was 10.48s. All other assets load within 2 seconds.
Then I deactivated Toolset completely and ran the same test again.
Without Toolset active, the average time to load the first file (main HTML) was 287ms.
With Toolset enabled, this page takes at least 10 seconds longer to load.
WHY IS THIS?
Note: it should be mentioned that in both these tests, the default Twenty Twenty theme was used.
Nigel
Languages: English (English ) Spanish (Español )
Timezone: Europe/London (GMT+01:00)
That's hardly a meaningful comparison, with and without Toolset, if Toolset is used to create and display your content.
You might as well re-write that comparison as "with no content on my site it takes no time to load, but is much slower when I enable all the content".
A meaningful comparison would be creating and displaying the content with Toolset, and creating and displaying the exact same content with some other tools, either other plugins or by writing bespoke PHP templates.
Toolset does include a lot of built-in optimisation with aggressive caching where possible, but as a general-purpose tool it couldn't be expected to match a custom solution.
That said, 10s does sound very slow.
I would first create an inventory of the content on the page. If it's just a single post being displayed via a template then something sounds wrong. If it's the home page with lots of nested Views to display related posts that include query filters using custom fields, these can start to add up and it may be that you should consider splitting some such content onto different pages rather than trying to show it all at once. (I'm not familiar with your site.)
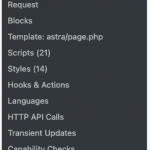
I suggest you add the Query Monitor plugin to your site, it produces a log of all the database requests on a page load which can help identify slow queries, and is the first port of call when looking at why the HTML itself takes a long time to be delivered (because the server spends a long time composing it).
If you see some specific queries that take a long time, it should be possible to identify what from your inventory of content is responsible for it. If you share those details we may be able to recommend changes to optimise displaying such content.
The page in question (although other pages showing Toolset content are also very slow) shows a single view, which pulls content from 117 posts.
I've installed Query Monitor, and refreshed the page to see the results, but I don't know how to interpret the dat it provides. It does say Slow Queries (1) and Duplicate Queries (11), which I'm guessing may be bad(?) but I have no idea what to do with this information.
Any page that is not showing Toolset content is very fast (likely due to the fast hosting I've got).
Hi Eric,
Thank you for waiting.
I tried to login using the access details from your first message, but it showed message "ERROR: User can't find."
During tests on my website with Toolset Types and Blocks, along with the Query Monitor, I didn't notice any slow queries, however, while viewing the page that you mentioned, I did saw some script and 404 not found errors in the browser's console, coming from "Autoptimize".
( screenshot: hidden link )
Errors like these can contribute to the page's loading times, so I'll recommend to temporarily disable "Autoptimize" plugin and share temporary admin login details again, so that we can look into the Query Monitor stats.
Note: I've set your next reply as private.
regards,
Waqar
Hi Eric,
Thank you for sharing the admin access.
While troubleshooting the queries, on the page in question ( hidden link ), I noticed that it consists of a fairly complex structure.
It is correct that the query for the main view "Lodge Cards" brings in only "117" results, but there are multi-level nested views involved too which multiplies the processing and further qeueries to 117 times.
( the view "Build mix classes" is nested in "Lodge Cards" views and two more views "Build mix species classes for lodge wrapper" and "Build mix package days classes for lodge wrapper" are nested inside the view "Build mix classes" )
Apart from the database queuries, the size of the page's total resources (like images, CSS & JS files etc) is 10.9 MB.
In my tests as a guest and as a logged-in admin, the page loads under 18 seconds on average, which is decent considering the amount of queuries and processing needed in the background and the content that needs to be rendered.
( please also note that at the moment there is no third-party cache or code/script minification active )
As Nigel pointed out earlier, Toolset plugins are a general-purpose tool that is designed to help with many different type of projects for users with different proficiency levels. We're constantly improving the built-in optimizations and cache utilization to speed up the processing, but this needs to be done without making compromises on the ease-of-use or the diverse nature of features. That is why it can't possibly compete in performance or page load times, with a fully tailored-made solution.
I hope this exaplaination will help.
regards,
Waqar
The slow speed cannot be explained by the file size, as most of the payload is loaded after the initial rendering of the page. Most of the page load time is due only to Toolset—again it's the "time to first byte" duration that is the big concern.
Your answer here is the most telling: "it can't possibly compete in performance or page load times, with a fully tailored-made solution". That makes sense, but it DOESN'T EVEN COME CLOSE.
My warning to future potential customers is that that for anything but the simplest of data-driven applications, Toolset is not a good solution if you care about site speed.
Hi Eric,
I've reviewed the structure of the page and unfortunately, I couldn't come up with any other alternative to what you have already done, that can further improve the performance (in the cotext of using Toolset's features). You need to show related content at multiple levels and for that nested views can't be avoided.
As mentioned before, the performance optimization of the built-in features is an on-going, yet meticulous process. But we always welcome and encourage feedback and suggestions and I'll share your feedback, to the concerned team too.
regards,
Waqar
Thanks Waqar, that's a reasonable response even if the plugin's performance is disappointing. I really hope your team can address the performance issues as I like a lot of Toolset but this is a key area where Toolset falls down when compared to ACF.


