Hi Minesh, thank you for your suggestions.
Currently, the memory allocated is set to 256MB, which should be sufficient for this project. We’ve also enabled WP_DEBUG, but no significant errors have been logged so far. We’re still investigating why no errors are showing and whether there might be an issue with how WP_DEBUG is capturing the logs.
Additionally, I wanted to share what our hosting provider, Flywheel, has mentioned regarding the performance issues. Here’s their reply:
--- START OF FLYWHEEL RESPONSE ---
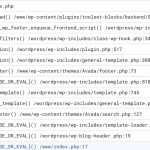
In regards to the Toolset Blocks plugin, we seem to be seeing the same recurring slow log mentioned below (see attached file slow-log.jpg)
Slow log events are PHP processes that take more than 5 seconds to process. This is significant because PHP processes typically happen almost instantly, so 5 seconds is substantial. We read them from the bottom (where the process starts) to the top (where the process stalled).
We are seeing this logged on nearly every uncached request to diagnosticariviera.it. I’d recommend reaching out to the plugin developer to see if they are aware of this and have a possible solution - based on the above it seems to be an interaction between Avada and the plugin.
--- END OF FLYWHEEL RESPONSE ---
According to Flywheel, almost every uncached request triggers a noticeable delay, and they believe this could be due to an interaction between Toolset Blocks and the Avada theme.
Do you have any insights or recommendations regarding potential compatibility issues between Toolset Blocks and Avada that we should explore?
We are using the latest versions of WordPress, all plugins, and the theme. Any further guidance you can provide on optimizing Toolset Blocks to reduce the load or improve performance in this context would be greatly appreciated.
Thanks again for your help.
Best regards,
Nicola
