This is the technical support forum for Toolset - a suite of plugins for developing WordPress sites without writing PHP.
Everyone can read this forum, but only Toolset clients can post in it. Toolset support works 6 days per week, 19 hours per day.
| Sun | Mon | Tue | Wed | Thu | Fri | Sat |
|---|---|---|---|---|---|---|
| - | 9:00 – 12:00 | 9:00 – 12:00 | 9:00 – 12:00 | 9:00 – 12:00 | 9:00 – 12:00 | - |
| - | 13:00 – 18:00 | 13:00 – 18:00 | 13:00 – 18:00 | 14:00 – 18:00 | 13:00 – 18:00 | - |
Supporter timezone: America/Jamaica (GMT-05:00)
This topic contains 12 replies, has 3 voices.
Last updated by Shane 4 years, 10 months ago.
Assisted by: Shane.
For a client i was asked to perform SEO for the given website. Initially i stumbled upon a extreme delay in loading up a page, of sometimes over 40 seconds or 27 seconds at best. See hidden link for example (27 seconds). I suggested to move the site over from their server to mines, where i have litespeed and redis object caching.
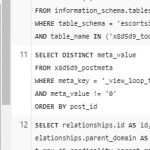
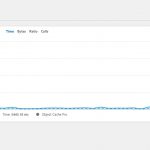
We've done tremendous things over the last few days but the main culprit for this website is the amount of queries performed in order to "spawn" a page. I'm talking about roughly 1500 database queries being executed with toolset views, toolset, cred front end editor and what more. All is obvious weaved out using Query Monitor.
So far i've optimized the database from 400MB large back to 61MB. There where lots of orphan and old data from proberly previous installations of various plugins. Als the options redirects was huge. Woocommerce coud'nt care less to spam the action logs table as well and everything is very neath now. Codewise we use litespeed to optimize as much as possible, and to relieve any of the database work we use redis object caching.
The best i could get was hidden link and it's quite stupid to know that toolset views is causing more then half of the queries involved to open up a certain page. When i disable toolset views the site obviously chrashes, i see a trace of a missing dependency here and there and once i comment these out, the amount of queries is HALVED for some reason, but it lacks certain functionality.
Currently we're using litespeed server crawling feature, which is the best we can go for. But we cant avoid that the database has to be updated or tested for fresh results once in a while. This is a website where edits and what more often take place, so really i would like to cut the problem at the core where it is. The ridiculous amount of queries performed by these plugins.
If it was up to me i suggest client to stop using wordpress for this purpose in general. But times currently are tough and i prefer seeking for a sollution. My dev of MC2 (you know, directadmin) pretty much concluded that this site should have bin blazing fast looking at the hard & software configuration but all these queries are causing a huge delay in initial loading time.
I have other wordpress websites, in none of these and they are pretty large too, this appears. This all narrows down to the use of toolset in general with a ridiculous amount of queries performed. I need a fix to cut 2/3rd of these queries and to make the performance acceptable again. Otherwise i cant perform SEO because a 6 seconds delay in loading time is just not acceptable. I have'nt build this website, and i see some traces of for example IONCUBE stuff going on, but that is to protect the previous webmasters script or work. One of the two, not sure. But it's not contained with malware or anything.
When i disable certain features of toolset views the amount of queries instant go in half; but in exchange important functionality onsite dissapears. So it's not a good option to start hacking in code till the point nothing works anymore.
Please provide a working fix that i can use in for example functions to strip the amount of queries performed here.
Hello, I'll be glad to take a closer look. Can you provide an administrator login for wp-admin so I can take a look at the Query Monitor results and analyze the setup for these pages?
Is it okay for me to temporarily activate a default theme and deactivate non-Toolset plugins during testing of this site to help isolate the performance issues you've described?
Hi Liviu,
Christian is currently on vacation at the moment so I'm having a look at this ticket for him.
I managed to log into the site but i'm not seeing the Toolset menu appearing on the navigation box. I did however check on your plugin version and before we can proceed further you will need to update all your toolset plugins to maintain compatibility. You can update the plugins from the link below.
hidden link
Don't worry the link will be private for other users of this page but I can remove it once we've resolved the issue.
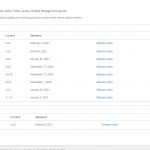
The views updates comes with many performs improvements as you are currently on version 2.7.2 while the latest version is 3.4.2 So I would recommend backing up the site before performing the updates.
Thanks,
Shane
For some reason, when you select an update and you hit download / activate, it gives the message "updated" and "activated" but after a refresh it's back to its v2.7.2 version again. Or in this case none of the toolset things are updated at all.
We are not sure what toolset menu navigation has anything todo with it, as Query monitor pretty much shows 400 to 900 queries being executed to load up one page as shown in the original starting post, done by a completely different plugin or addition then you are suggesting.
I did find something else while updating these plugins in the meantime:
2021-04-07 19:10:45.257118 [NOTICE] [9286] [xxx:12944#APVH_www.xxx.xxx:443] [STDERR] WordPress database error Duplicate entry '0' for key 'PRIMARY' for query INSERT INTO `something_postmeta` (`post_id`, `meta_key`, `meta_value`) VALUES (13167, 'views_woo_on_sale', '0') made by do_action('wp_ajax_installer_activate_plugin'), WP_Hook->do_action, WP_Hook->apply_filters, WP_Installer->activate_plugin, activate_plugin, do_action('activate_woocommerce-views/views-woocommerce.php'), WP_Hook->do_action, WP_Hook->apply_filters, Class_WooCommerce_Views->maybe_start_processing_products_fields, Class_WooCommerce_Views->start_processing_products_fields, Class_WooCommerce_Views->batch_process_products, Class_WooCommerce_Views->process_product_fields, update_post_meta, update_metadata, add_metadata, QM_DB->query
This means that the WP POSTmeta appears to be corrupt; hence the Duplicate Entry 0 for key Primary. I will solve this now by changing this to Auto Increment and rerun everything again. The database was corrupted once i moved this from one to another server. Will post in a minute.
Could one of you explain to me, why this data such as cookie's being pushed towards one of your servers? Like which things i recently had access to?
2021-04-07 19:18:19.646191 [NOTICE] [12234] [162.158.158.55:9788#APVH_www.xxx.com:443] Content len: 0, Request line: 'GET /wp-admin/plugin-install.php?tab=commercial HTTP/1.1'
2021-04-07 19:18:19.646200 [INFO] [12234] [162.158.158.55:9788#APVH_www.xxx.com:443] Cookie len: 1444, wordpress_sec_749f7024e3ccd248d8742d7a01808bfa=user%7C1618015193%7CC3Ri1sBEAly6T3r0exLLI8NPtHvozRKEmKR2hQ2jiXE%7Ca73d4cdc743ba226b551b5d7a42f8fea151388add75ed9dcdf00cf6609be0c34; autoptimize_feed=1; wordpress_logged_in_749f7024e3ccd248d8742d7a01808bfa=user%7C1618015193%7CC3Ri1sBEAly6T3r0exLLI8NPtHvozRKEmKR2hQ2jiXE%7C9388b47aea433ace0a1b790591b0bc571120294efb09493ff1f27278bd65e417; redux_current_tab=26; redux_current_tab_get=26; ls_smartpush=ffffffffffffffff; cookie_data_lastviewed_widget_2=14851%2C17490%2C14821%2C14822%2C14795%2C15453%2C14819%2C15474%2C14826%2C14824%2C14823%2C15128%2C15216%2C15441%2C16003%2C15447%2C14793%2C14792%2C15458%2C15456%2C15089%2C14825%2C14827%2C15493%2C17750; cookie_data_lastviewed_widget_3=14851%2C17490%2C14821%2C14822%2C14795%2C15453%2C14819%2C15474%2C14826%2C14824%2C14823%2C15128%2C15216%2C15441%2C16003%2C15447%2C14793%2C14792%2C15458%2C15456%2C15089%2C14825%2C14827%2C15493%2C17750; cookie_data_lastviewed_widget_4=14851%2C17490%2C14821%2C14822%2C14795%2C15453%2C14819%2C15474%2C14826%2C14824%2C14823%2C15128%2C15216%2C15441%2C16003%2C15447%2C14793%2C14792%2C15458%2C15456%2C15089%2C14825%2C14827%2C15493%2C17750; __cfduid=d5cabfaec6920b3b2b0d8d9ec473dc3ba1617706687; redux_update_check=3.6.18; tk_ai=woo%3AWLhOy%2BCIflKEVFnit3pxXoAK; _lscache_vary=admin_bar%3A1%3Blogged-in%3A1%3Brole%3A99; wp-settings-time-42888371=1617815377; cf_ob_info=524:63c4e4523ec35415:LHR; cf_use_ob=0
For some reason this is timing the complete website now. Note that the IP adress is from cloudflare, but it's obvious that data is send towards your services isnt it? Shoud'nt you add a disclaimer with WHAT data you exactly are collecting here?
Ok, installing Toolset Framework Installer caused an endless loop that even 9000seconds timeout in Litespeed coud'nt solve.
It basicly tells me it's updating and activated, but after a refresh it's not. Most of the database errors where solved now, i.e primairy = 0 etc. Btw when the site is loaded up with none of the toolset plugins the load time is less then a second. Once you start activating this toolset (garbage) the load time boots up to 6 to 8 seconds. Something is very wrong here.
I still dont understand how "staff" here cant see the obvious 400 queries being executed in WP-Admin by Toolset-blocks,
Its causing a huge delay in loading but also on my database. Adding redis only solves this for a few percent but ive never seen a wordpress site anything out of the order like this one.
It's not updating the packages either, even tho there is a available license, and it chrashes pretty much the complete website once you install Toolset Framework Installer. Errorlogs show that litespeed just closed the thread after 9000 seconds or so.
Maybe toolset is'nt capable of handling large datasets without taxing the database in extreme matters. Perhaps thats just what is going on. I wanted a shortcode or something like that to drasticly cut up the amount of queries this needs to execute upon every refresh. If it's not capable of doing that then ill suggest my client to ditch toolset, ask for a refund, and simply build a proper website that is capable of handling over thousands of advertisements and visitors.
Ah well.
Hi Liviu,
I had an extensive look at the information and the queries.
Nothing on the page would lead me to suspect that the queries aren't needed. I suspect the view itself is very complex and is also pulling relationship data as well, which in itself will spawn a query for each post.
Also getting the meta data for each post such as custom fields and taxonomies will spawn a different query for each post that is being displayed in the loop. So as you can understand based on your dataset and the requirements of what is being displayed on the page a query is needed to pull that information from the database.
All of this data isn't being pulled on the initial query to pull all the post for the currently viewed page. This in itself would be a single query to return all the posts for page 1. The additional queries make up the taxonomy query, the post meta query and the relationship query for each post and can get complex if you're pulling meta data from the parent post as well.
So there isn't a simple way of using a shortcode to reduce the number of queries. Rather the best way to improve speed is to use cache as you are doing right now.
You can also explore the cache settings for views and set it to where you have to manually clear the cache for the view.
hidden link
Go to the frontend content tab and scroll to cache. This may help reduce the number of queries since you won't need to query the database for the custom fields each time the view is loaded.
Please let me know if this helps.
Thanks,
Shane
No, it does'nt really help. We already have litespeed and redis object (=database) caching going on at it's strongest level.
I have more bigger websites running better on the same server then this relatively small website. hidden link
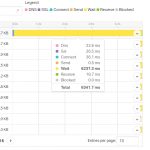
It's still over 7 seconds "wait state" while the DNS query is less then 11ms. This is just pure the database query going on in the background before it's finished or even done. However when you do surf on deeper pages it loads instant, because there are no queries and its purely driven from cache. The litespeed server settings have lots of resources and even the memory limit of this website is set to 512MB.
I am dev for 13 years, i.e hidden link and optimising websites for speed, security but also handling lots of visitors is a profession i do. The problem here is that 400 queries are being executed among every visit or hit targetted at that page, and it's slowing down significantly. I mean before i started we had an avg of 23 up to 40 seconds before something would even happen. Ive done my homework in this case but i cant seem to evade the 7 seconds.
When i disable toolset(s) completely, it's well below 0.8 seconds with a dozen of plugins loaded. But that obvious kills the purpose of the website. So i know it's nothing of the configuration at soft or hardware end. I had a dev of MC2 taken a look at it, they concluded pretty much the same that the performance of this website is purely caused by toolset.
It's up the client what todo with this or not. If i was him, wordpress is'nt the base package you use for something aimed at "the world". The performance will tank completely when such websites have to handle 500 visits a minute. Even if you throw 10 servers at it at some point, it still woud'nt be enough. WordPress is just alot of overhead.
I think i fixed the core culprit here. As i wrote before, the "database" showed signs of corruption. Now in Woocommerce, it has this table wp_actionscheduler_logs that would grow immensly after just a few hits into's the hundred of MB's per minute. In one day the database would have grown all the way up to 4GB large coming from just 70MB.
The index was'nt there anymore; and when i truncated the whole table and rebuild it by assiging the ID as Index / Auto Increment enabled, the whole thing is speedy as F again. I also disabled cronjobs completely, and the whole sitespeed ( still at the high side, but at least it's cached now) is nuked.
We're going to replace the website with a better project that can handle or stand 1000's visits a minute seamless; my first thought was to hack the query toolset would doing by simply replacing it with select * from blabla where row1 = `something` in order to bypass the whole 400 ~ 1200 queries needed to spawn one page.
But it's not needed anymore. I just confirmed with a few browsers that it's finally working. Ive set the litespeed crawler to active and it's currently indexing the website and storing this in a large set of cache.
Hi Liviu,
Thank you for the update on this one.
Not sure what other advice I can provide on this one as from your post it would appear that you were able to identify and resolve the issue.
If there are no further questions then you can go ahead and mark this ticket as resolved.
Thanks,
Shane


