Skip Navigation

[Resuelto] Site with high CPU seconds

This support ticket is created hace 1 año. There's a good chance that you are reading advice that it now obsolete.

This is the technical support forum for Toolset - a suite of plugins for developing WordPress sites without writing PHP.

Everyone can read this forum, but only Toolset clients can post in it. Toolset support works 6 days per week, 19 hours per day.

Hoy no hay técnicos de soporte disponibles en el foro Juego de herramientas. Siéntase libre de enviar sus tiques y les daremos trámite tan pronto como estemos disponibles en línea. Gracias por su comprensión.

Sun Mon Tue Wed Thu Fri Sat
- 7:00 – 14:00 7:00 – 14:00 7:00 – 14:00 7:00 – 14:00 7:00 – 14:00 -
- 15:00 – 16:00 15:00 – 16:00 15:00 – 16:00 15:00 – 16:00 15:00 – 16:00 -

Supporter timezone: Europe/London (GMT+00:00)

Este tema contiene 3 respuestas, tiene 2 mensajes.

Última actualización por Stephen Vaughan hace 1 año.

Asistido por: Nigel.

Autor
Mensajes
#2660021
Screenshot 2023-11-03 at 9.17.40 a.m..jpg

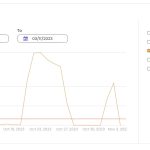
Good morning. I have been tackling an issue that my hosting SIteGround flagged last week where on of my sites is using a high level of resources, specifically CPU seconds (see image attached). I did extensive troubleshooting last Friday with plugins off, rollback to previous backup of the site before the problem started on the 20th of this month. I did get the issue under control last Friday. Suddenly the graph droppded but last evening I noticed that CPU seconds had kicked up again. I put the site into maintanence mode and turned off all plugins for an hour and this seems to have calmed things done again.

I have had SiteGround support look into this as well and they tell me that there is something making a high volume of queries from the site to the products on the site. I include some of the transcript from last week and yesterday below.:

__ Last week

For the past 24 hours these are the IPs which made most requests to your site:
20922 35.207.163.157
165 51.171.111.52
15 192.0.100.186

The IP which makes most requests is 35.207.163.157, which belongs to the server. This means that there is a script/tool/plugin on your site which makes requests to the site itself. The user agents of the request is:
WordPress/6.3.2; enlace oculto

A small portion of the requests are made by the internal WordPress cron, so please consider adding a real cron job replacing the native one.

__

I set up the cron job.

__ Yesterday

I checked in detail and for the last 24 hours, the website letsgoastrothomastown.com used 183 397 CPU seconds. It seems the server IP: 35.207.163.157 made almost 40,000 hits to the website for that timeframe.

For some reason, different pages are requested, but these requests don't reveal the plugin that initiated them. Here are a few samples:
35.207.163.157 enlace oculto - [02/Nov/2023:16:46:55 +0000] "GET /product/right-back-side-b-3f/ HTTP/2.0" 200 25380 "-" "WordPress/6.3.2; enlace oculto" | TLSv1.3 | 1.167 1.229 1.229 MISS 0 NC:000000 UP:SKIP_CACHE_SET_COOKIE
35.207.163.157 enlace oculto - [02/Nov/2023:16:46:56 +0000] "GET /product/right-back-b-1a/ HTTP/2.0" 200 25414 "-" "WordPress/6.3.2; enlace oculto" | TLSv1.3 | 1.306 1.382 1.382 MISS 0 NC:000000 UP:SKIP_CACHE_SET_COOKIE
35.207.163.157 enlace oculto - [02/Nov/2023:16:46:58 +0000] "GET /product/right-back-side-b-4f/ HTTP/2.0" 200 25382 "-" "WordPress/6.3.2; enlace oculto" | TLSv1.3 | 1.169 1.230 1.230 MISS 0 NC:000000 UP:SKIP_CACHE_SET_COOKIE

Is there is anything in this or the example from the logs that you see as a known issue it would be appreciated.

Just so you know the main queries via views would generally be from this page:

enlace oculto

Although not apparent on first load, there are 17 views with a total of 417 products being presented on popups. Maybe this is a step to far? I have been running the site since July and there hasn't been an issue at other times so not sure my set up would be the problem.
#2660997

Nigel
Supporter

Idiomas: Inglés (English ) Español (Español )

Zona horaria: Europe/London (GMT+00:00)

Hi Stephen

There's little in the log you shared that points to the source of the problem.

You say the page with the 17 Views is this one?

enlace oculto

These are not front-end requests, given the IP is your own server IP. (And I couldn't reproduce such requests or anything like them when navigating your site and inspecting the network traffic.)

Same applies to requests when editing pages in the back end.

I'm struggling to see how they could arise when, say, editing the page in the back end that contains many Views. There would be browser-based REST API requests, and probably lots of them, but these would have the browser as the source of the request, not the server. The code running on the server triggered by such requests would query the database etc., but it wouldn't be making requests that look like those in your log, I don't think.

So it seems more like an automated process, or—I guess—it could relate to some other plugins on your site, but I don't know what they are nor how they work. Toolset runs CRON jobs to handle expiring posts created with CRED forms, not anything else I can think of.

So, I'm sorry, but I'm at something of a loss to explain the avalanche of requests you are seeing.

I wonder if your host can enable more verbose logging that gives more details of the requests that would help trace the source.

#2661077

Thanks Nigel,

Your input is much appreciasted and clears up for me any any misconceptions I might have about using views to the extent I have.

It's a strange one and a bit more info to add that could indicate something else, perhaps sinister? I recieved a Weekly Activity for the Let go Atro site email form SiteGround this morning, along with other emials I get for all the other sites I manage. I usually delete these but, I did notice that the Human traffic on Let's go Astro was phenominally high compared to the other sites. It doesn't make snsce as I use the StatCounter plugin to measure traffic and it hasn't been showing anything like the number for Human trafic in the email? I wonder does this give us a clue on what could be going on? Could this indicate some kind of cyber attack?

#2661083

An update. SiteGround confirm that this isn't anything sinister like an attack on the site. It is coming from somenthing internal to the install for example a plugin.